Short answer: Jira has no velocity report per person. Its velocity report measures the whole team on a board. You can still get completed story points per assignee by exporting a search to a spreadsheet, and that number is useful for planning capacity. As a measure of how well someone works, it misleads, for reasons this article covers below.
If you are after the team number, start with how to calculate sprint velocity in Jira.
What Jira gives you out of the box#
The Velocity Chart in company-managed projects and the velocity report in team-managed ones show what the team committed to and completed in each sprint. Neither has an assignee filter or a breakdown by person. The only thing that narrows the chart is the board’s saved filter.
So every route to a per-person number is a workaround. There are three worth knowing.
Method 1: export a search and add it up#
This is the method Atlassian’s own support article describes, and the one to try first.
- Search for the sprint’s issues with JQL, keeping only finished work:
project = PAY AND sprint = "Sprint 24" AND statusCategory = Done ORDER BY assignee ASC - Add Assignee and your story points field as columns in the results. Use the field your board estimates with — see which field holds your story points.
- Export the results to Excel or CSV.
- In the spreadsheet, make a pivot table: Assignee in the rows, the sum of story points in the values.
Repeat it for a few sprints and average each person’s total, the same way you would average team velocity.
The trap: sprint = X counts carried-over work twice#
Jira’s Sprint field keeps every sprint an issue has been in. An issue that started in Sprint 23, was
carried over and finished in Sprint 24 matches sprint = "Sprint 23" AND statusCategory = Done as
well as the same search for Sprint 24. Run that search for several closed sprints and the same points
are counted more than once. The search also picks up work that was left unfinished and closed long
after the sprint ended.
We tested this on Jira Cloud with a sprint that finished 8 points, plus a 5-point issue carried into the next sprint and a 3-point issue finished later. The Velocity Chart showed 8 completed. The search added up to 16.
To count work in the sprint it actually finished in, filter by when it reached done rather than by the Sprint field:
project = PAY AND status CHANGED TO "Done" DURING ("2026-10-05 09:00", "2026-10-16 17:00")
Use the status your board treats as done, and the times the sprint started and closed. Give times rather than bare dates: they are read in your own time zone, and they leave no doubt about the last day of the sprint.
Method 2: a board for one person#
The Velocity Chart only includes work that matches the board’s saved filter. So a company-managed
Scrum board whose filter adds assignee = <person> draws a velocity chart for that person.
It works, but it has costs: one board per person, and the chart follows the current assignee, not the person who did the work. When we unassigned a finished 2-point issue on a test board, its points disappeared from that sprint’s bar straight away.
Method 3: gadgets and reporting apps#
The Two Dimensional Filter Statistics dashboard gadget can show assignees against sprints, but Jira users report that it counts issues rather than summing story points. A count treats a 1 and a 13 the same.
For a real report, several reporting apps on the Atlassian Marketplace add per-person views. We do not build one, so try a few on your own data, and check how each handles carried-over issues.
Why per-person velocity misleads#
Before you put this number on a slide, it helps to know what it does not measure.
- All the credit goes to the assignee at the end. Points follow whoever holds the issue when it closes. Reviewers, testers and the person who paired on the hard part get nothing.
- Points are relative to a team. They are comparisons between pieces of work, agreed by the group. They were never a unit of individual output, so one person’s 20 is not comparable with another’s.
- Helping others scores nothing. Someone who spends a sprint unblocking teammates can show a low total in the sprint the team did its best work.
- People respond to what is measured. Once the number is used to judge individuals, estimates drift upward and helping a teammate starts to cost you points. The team’s velocity gets less useful as a result.
The Scrum Guide puts the accountability on the group: “The entire Scrum Team is accountable for creating a valuable, useful Increment every Sprint” (The Scrum Team).
What to look at instead#
Most people searching for per-person velocity are really asking one of two questions.
“How much can we take on?” That is team velocity. Use the average of recent sprints, and adjust for known absences.
“Is anyone overloaded?” That is about the sprint you are about to start, not about past sprints. You need each person’s planned load, compared with the rest of the team and with their availability. A person with the most points planned in a week they are off is a problem you can still fix, which history will not show you.
Planned load per person in Scope Planner#
Scope Planner is a Jira Cloud app for estimating a sprint in one table. It does not report past velocity per person. It shows each person’s load in the sprint you are planning, while you estimate. It is on the Atlassian Marketplace, with a free trial.
- Breakdown groups the totals by assignee, as well as by epic, label or type, and updates as you type. It is free.
- Workload (Pro) shows each person’s story points with a bar and flags anyone above 1.5× the average of everyone with work. Unassigned work is listed but never flagged, and does not skew the average.
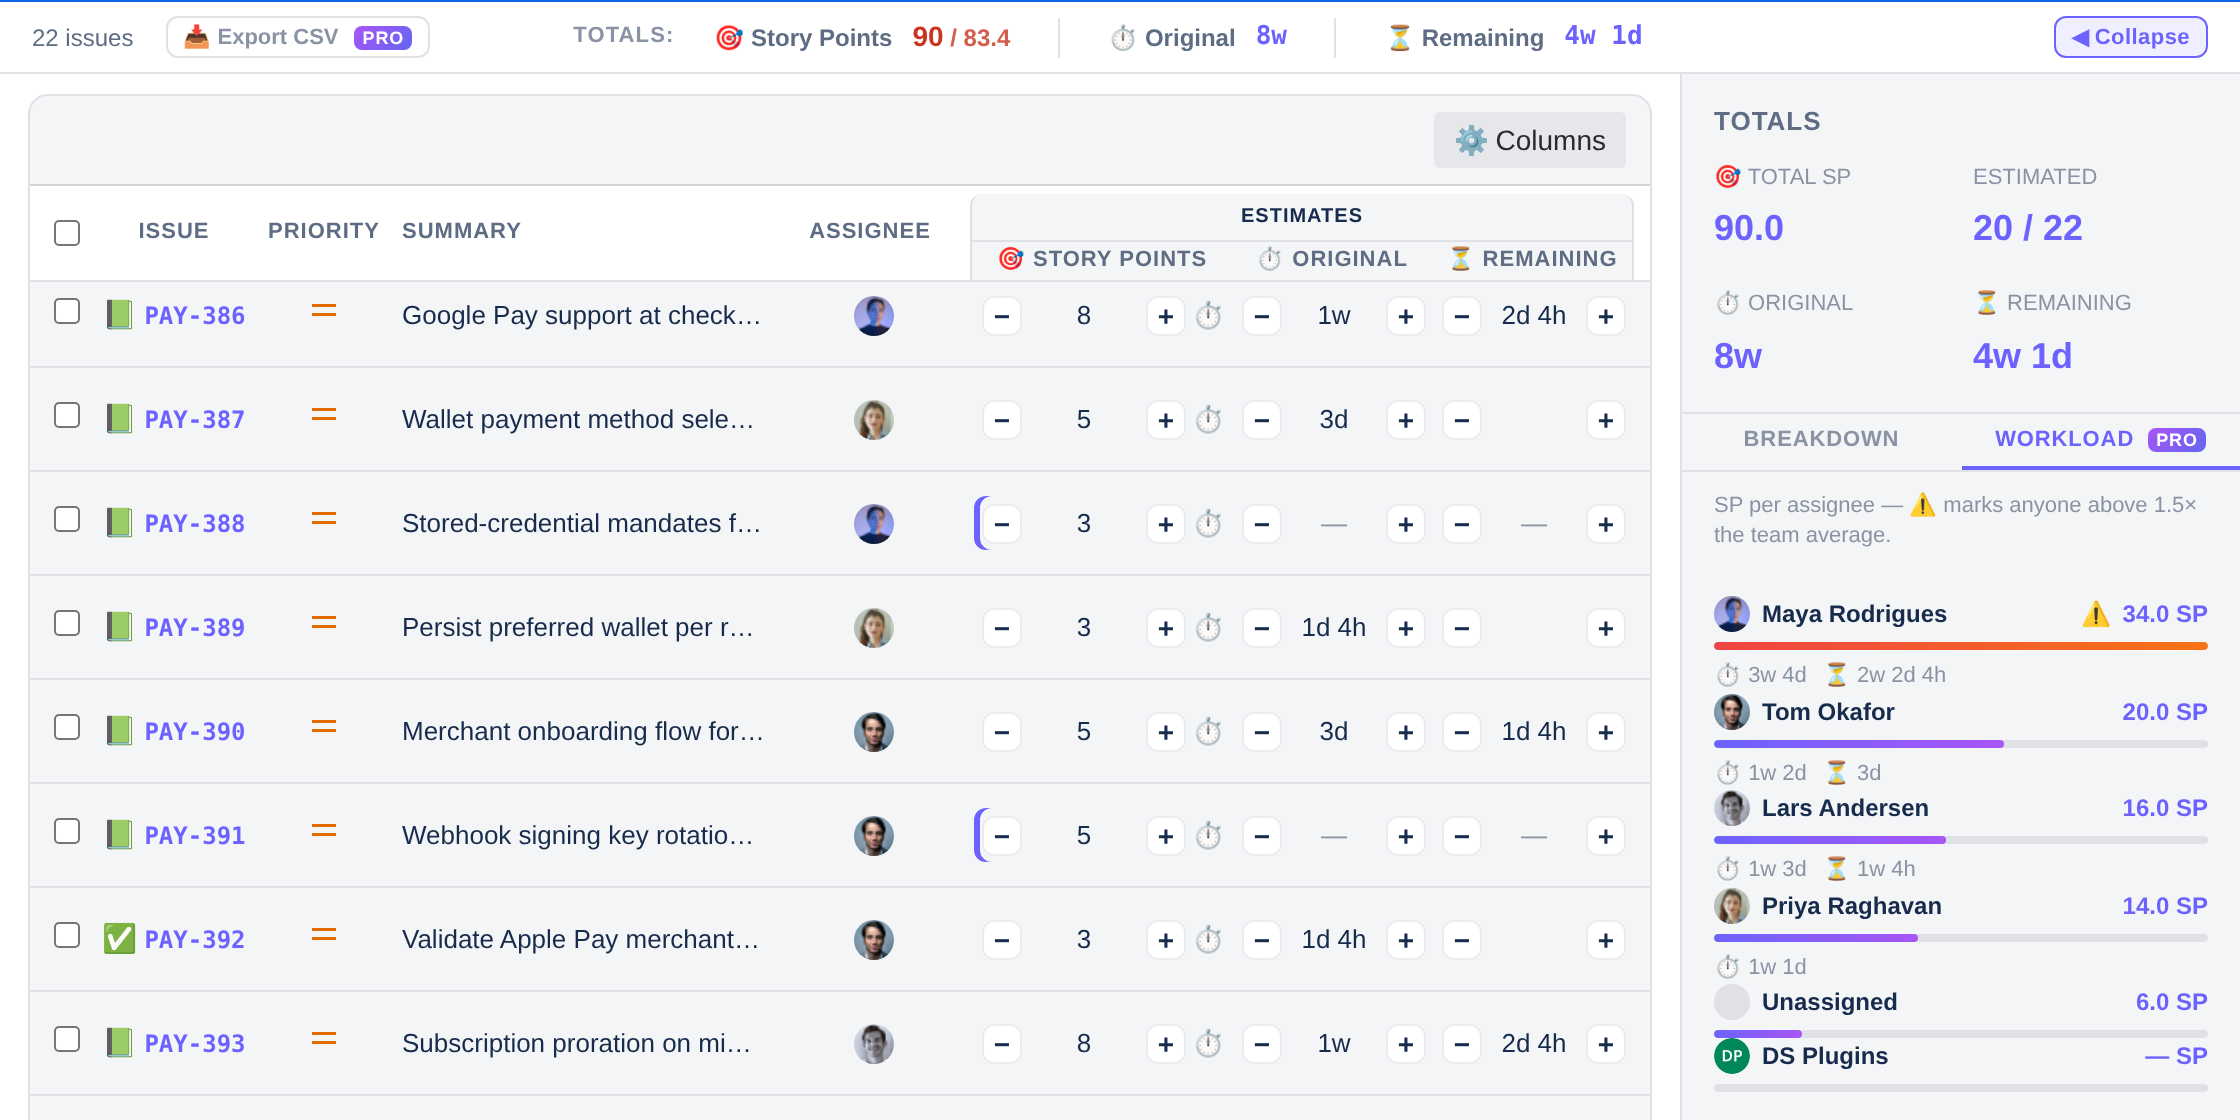
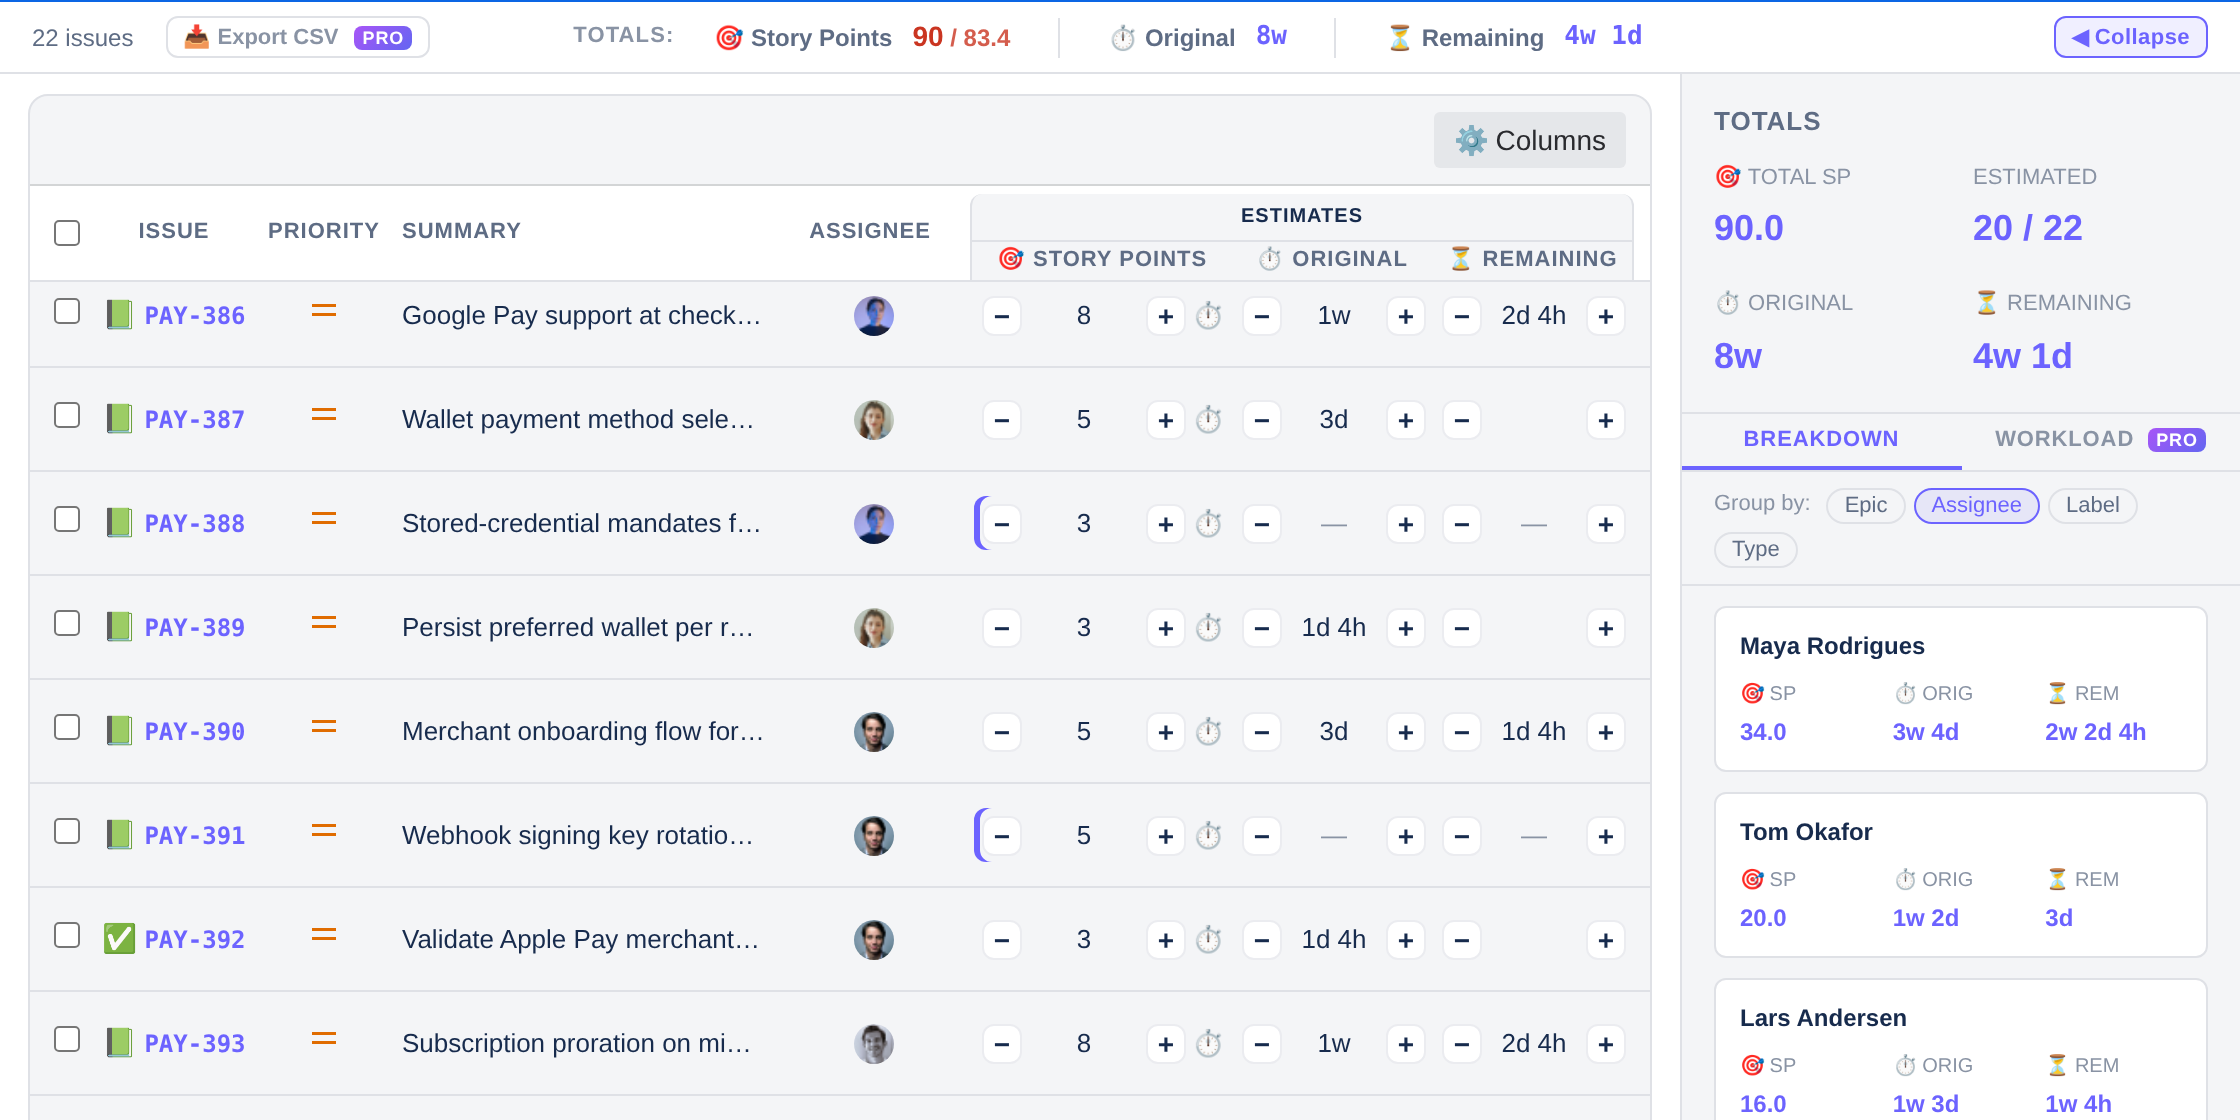
Together with target velocity, that answers both questions above before the sprint starts. See Free and Pro for the split, and Totals & breakdown in the user guide.
Frequently asked questions#
Does Jira have a velocity report per user?#
No. The Velocity Chart and the velocity report are team-level, with no assignee filter. You can export a search and sum story points by assignee in a spreadsheet, or use a board filtered to one person.
How do I see story points per assignee in a sprint?#
Search for the sprint with JQL, add Assignee and your story points field as columns, export to Excel or CSV, then sum by assignee. Atlassian’s support article describes this method. In Scope Planner, the Breakdown tab shows it live for the sprint you have open.
Can a Jira dashboard show velocity per person?#
Not in story points, as far as we can tell: users report that the Two Dimensional Filter Statistics gadget counts issues rather than summing a field. For points per person on a dashboard you need a reporting app from the Marketplace.
Should individual velocity be used in performance reviews?#
We would advise against it. It credits only the final assignee, compares points that are only meaningful within a team, and encourages inflated estimates. Use it, if at all, to understand capacity.
How do I plan capacity per developer?#
Start from the team’s average velocity and subtract known absences. Then compare each person’s planned load with the others’ before the sprint starts, and move work away from anyone well above the average.