Short answer: sprint velocity is the amount of work a team finishes in a sprint, usually in story points. Average velocity is the sum of the completed work over your last few sprints, divided by the number of sprints. Jira draws both on its velocity report, and you can check the number yourself in a minute.
This article shows where to find the report, what each bar means, how to calculate the average, how to turn it into a plan for the next sprint, and which mistakes make it misleading.
Where to find velocity in Jira#
Where the report lives depends on the type of project. Jira now says space for project and work item for issue; this article keeps the older words, which are the ones most people search for.
- Company-managed Scrum projects: in the sidebar, open Reports, then Velocity Chart. Only Scrum projects have it. See Atlassian’s Velocity Chart guide.
- Team-managed projects: the velocity report is under Reports too, but the Sprints feature has to be turned on first.
What the Velocity Chart shows#
Each recent sprint gets two bars, and a line shows the average.
| On the chart | What it is |
|---|---|
| Commitment (gray bar) | The total estimate of the issues in the sprint when it began |
| Completed (green bar) | The total estimate of the issues completed when the sprint ended |
| Average (black line) | The work completed on average across the sprints shown |
The details decide whether your number can be trusted:
- Work added after the sprint starts is not part of Commitment, but it does count in Completed if it gets finished.
- Estimates changed after the sprint starts do not change Commitment.
- Carried-over work counts once, in the sprint it was finished. Work left unfinished when a sprint closes adds nothing to that sprint, even if it gets done later. We checked both on a test board.
- “Done” means the board’s right-most column. An issue counts as completed when it reaches a status mapped to that column.
- Subtasks are not included. Their estimates do not reach the chart.
- Only the board’s filter counts. The chart includes only issues that match the board’s saved filter.
- Only the board’s estimation field counts. Velocity uses the one statistic the board estimates with, chosen in its settings. Points typed into another field are invisible to it — see story points vs. time estimates.
How to calculate velocity yourself#
The formula is simple:
Average velocity = (Completed in sprint 1 + … + Completed in sprint n) ÷ n
Take the Completed values of your last five sprints, for example:
| Sprint | Commitment | Completed |
|---|---|---|
| Sprint 20 | 40 | 34 |
| Sprint 21 | 42 | 41 |
| Sprint 22 | 38 | 29 |
| Sprint 23 | 40 | 38 |
| Sprint 24 | 40 | 36 |
| Average | 35.6 |
(34 + 41 + 29 + 38 + 36) ÷ 5 = 178 ÷ 5 = 35.6 points per sprint.
How many sprints should you use? Atlassian’s guide notes that more sprints give a more accurate forecast. Five is a common choice: enough to smooth out a bad sprint, recent enough to describe the team you have now. Leave out a sprint that says nothing about the team, such as one where nothing was completed.
Sprint completion rate and scope change#
Two related numbers come from the same data. Jira shows the bars, so you work these out yourself.
Sprint completion rate shows how much of the plan was delivered:
Completion rate = Completed ÷ Commitment × 100
For Sprint 22 above, 29 ÷ 38 × 100 = 76%. Because Completed can include work added mid-sprint, the rate can exceed 100%. Read it over several sprints rather than judging one.
Scope change shows how much the sprint moved after it started. The sprint report lists what was added and removed. A common way to express it:
Scope change = (points added + points removed) ÷ Commitment × 100
High scope change usually explains a low completion rate better than the team’s speed does.
Turning it into a planning number#
Plan the next sprint at about the average, then adjust for what you already know: holidays, a new teammate, an unusual amount of support work. With an average of 35.6 and one of six people away for the whole sprint, about 30 points is a reasonable starting point.
Use the average, not your best sprint. And compare the plan against it while you estimate, not after the sprint has started.
For a release rather than the next sprint, one average is too precise: this velocity forecast calculator turns your last few sprints into a best and a worst case.
Mistakes that distort velocity#
- Changing estimates after the work is done. Re-pointing a finished issue rewrites history, and the average stops describing the team.
- Comparing teams. Points are relative to the team that assigned them; one team’s 40 is not another’s.
- Counting half-done work. Splitting an unfinished issue and crediting the “done half” inflates the number. Carry the issue over and let it count when it is finished.
- Treating it as a target. Asking a team to raise velocity mostly raises the estimates.
- Judging individuals by it. Velocity is a team measure. If you need a per-person view, read velocity per assignee in Jira first.
- Too few sprints. One or two sprints are noise. Wait for four or five before trusting the average.
Planning against velocity in one table#
Scope Planner shows the sprint total next to a target velocity while you estimate, so you see the sprint overflow before you start it, not halfway through. It is on the Atlassian Marketplace, with a free trial.
- The totals bar shows the sprint’s story points and, when a target velocity is set, a capacity indicator that highlights when the draft total goes over it.
- With Pro, ✨ Auto-calculate fills the target from the average of the board’s last five completed sprints, so there is no number to maintain by hand.
- Also with Pro, the Workload tab shows each assignee’s points and flags anyone above 1.5× the team average, so you can rebalance before the sprint starts.
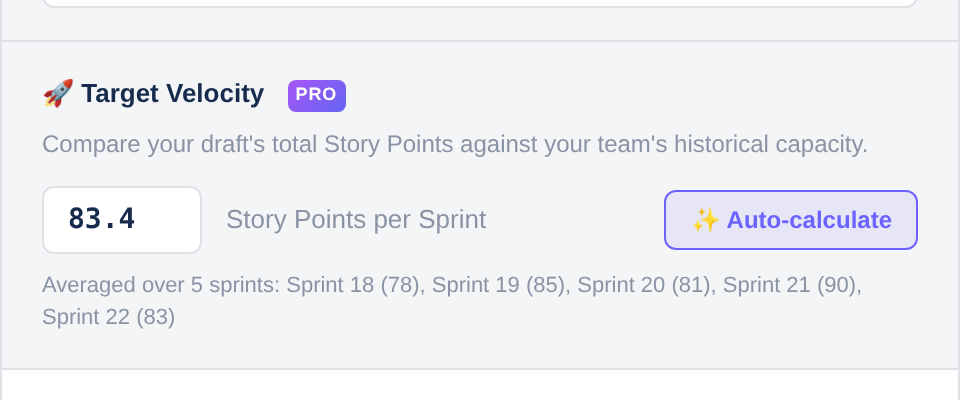
The estimation table, drafts and totals are free; target velocity, workload and publishing to Jira are Pro — see Free and Pro and Preferences in the user guide.
Frequently asked questions#
How is velocity calculated in Jira?#
Jira adds up the estimates of the issues completed in each sprint, and the Velocity Chart shows the average across the sprints it displays. To check it, add the Completed values and divide by the number of sprints.
Why is my velocity chart empty?#
Usually the issues are not estimated in the field the board reads, or no sprint has been completed yet. Check the board’s estimation setting first, then that the issues reached a status in the board’s right-most column. In a company-managed project the chart is only available for Scrum.
Can I see velocity for all sprints?#
The chart shows the most recent sprints the team completed, and Atlassian’s guide does not describe a setting to change how many. For a longer history, read the numbers sprint by sprint and keep them in a spreadsheet.
What is a good velocity?#
There is no universal number, because points only mean something within one team. A good velocity is a stable one: it lets you forecast. A sudden jump usually means the estimates changed, not the output.
Does Jira show velocity per person?#
No. The velocity report is team-level. Velocity per assignee in Jira covers the workarounds, and why to be careful with them.